Republic Day: How Many Positive Changes Has India Had Over The Decades? Find Out
Let’s harness the power of data to make sharper decisions and achieve a better impact. On this Republic Day, let’s resolve to look at facts and act fast for better India!
Every January and August, we become more aware of our Indian-ness. Online and offline conversations burst with expressions of pride, devotion and love for the country, peppered with anguish, concern and despair with the state of the nation.
How much of that despair is rooted in reason? And how much of that devotion translates into action? What can all of us, as citizens, do to make India better? How well do we know the state of our nation?
India is changing. Do we know how and how much? We ran a very brief and quick quiz to check.
Before you proceed with this article, take the quiz here (Spoiler alert: The rest of this article may reveal some answers, so take the quiz first!)
Here is what we found with the first 300 responses – mostly collected from an urban, well-educated and well-read crowd, a majority of which works in the corporate sector.
1. Life expectancy: A good majority (79 per cent) got current Indian life expectancy right. About seven per cent were overly optimistic, and a good 14 per cent thought we were much worse than reality.
2. Urbanisation: Again, a majority (80 per cent) answered correctly on the percentage of our total population that lives in rural areas. About 5 per cent thought we were still 90 per cent rural, and 15 per cent thought only about 30-40 per cent of the population was in rural areas.
That’s where the majority of correct answers ends!
On the remaining questions, here is how we as a society just don’t know about our own progress:
3. The number of registered companies in India: Less than half (45 per cent) of respondents got this range of number right. 43 per cent went with a range that is 1/10th of the actual number, and 12 per cent picked a range that’s 1/20th of the right answer.
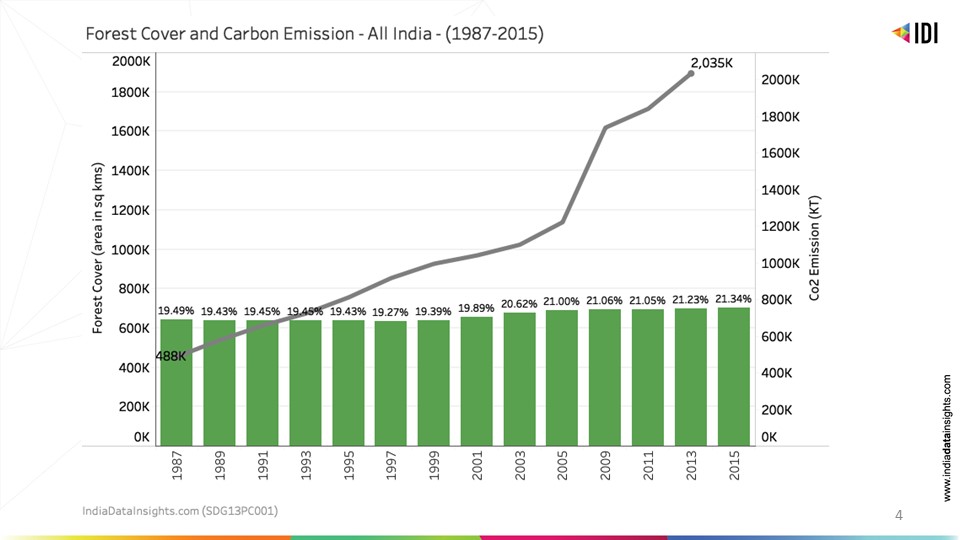
4. Forest cover in India over the last decade: Only 24 per cent of the respondents knew that it has actually improved (data here), rest 76 per cent think that it has decreased.
5. Annual per capita income: Here is how we STILL think of ourselves as a poor country, unfortunately – Only 15 per cent got this answer right. 35 per cent thought it is HALF of what it actually is. And a whopping majority of 50 per cent thought that it is only a QUARTER of what it is in reality.
The general perception of our income level was an eye-opener for us. While it is understandable that most of us do not really need this socio-economic data for our day-to-day functioning, doesn’t this impression also shape how we think of ourselves as a country? Does it not affect our confidence as a society?
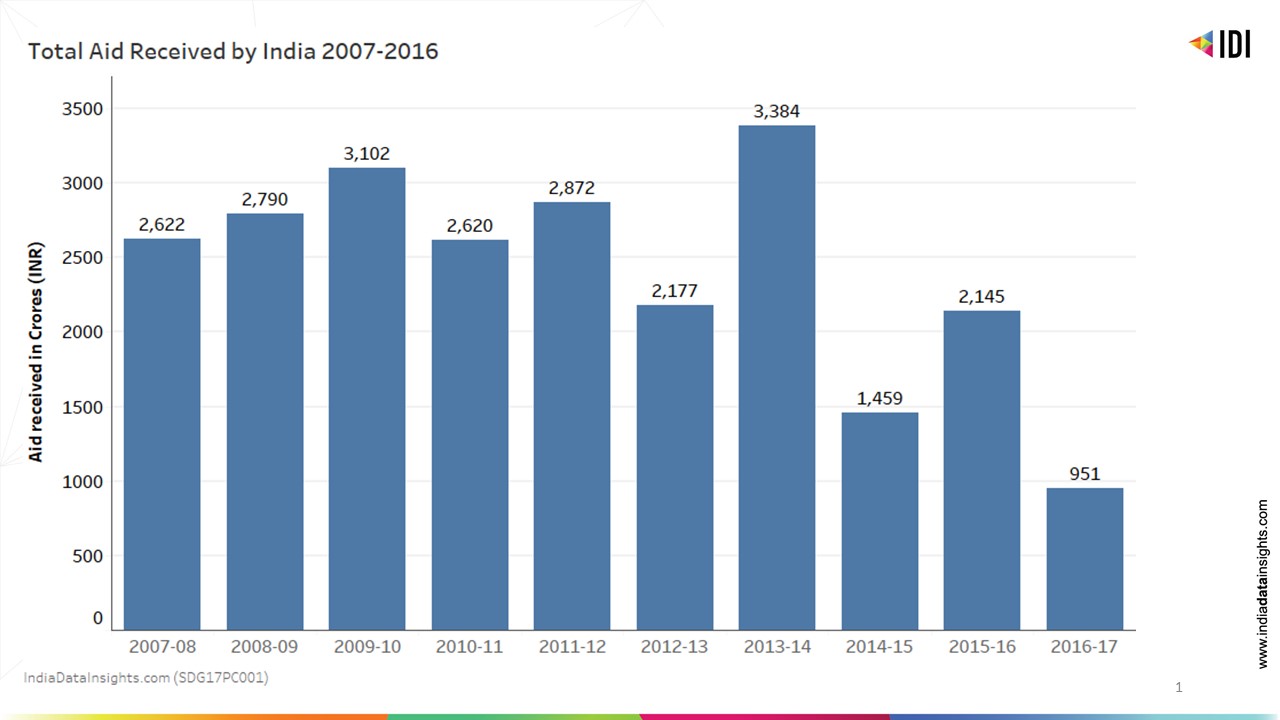
For example, did you know that we have been taking in lesser foreign aid:
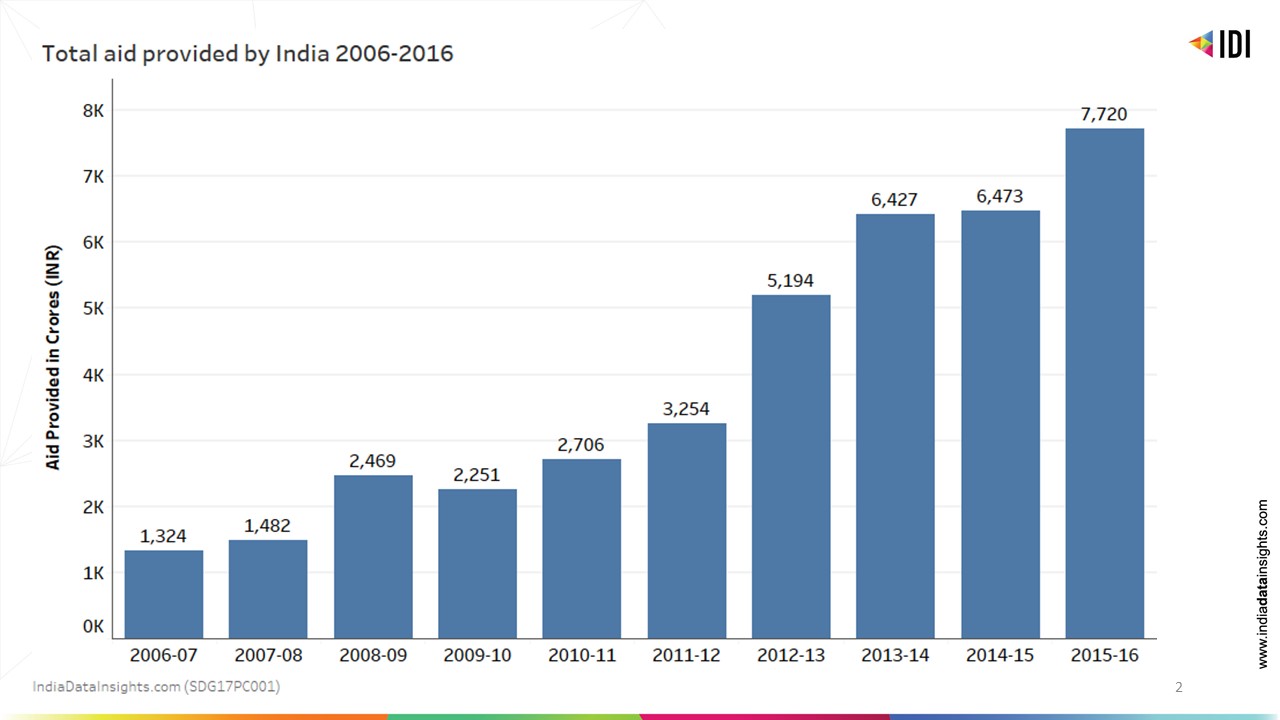
We have actually been giving more in aid to others.
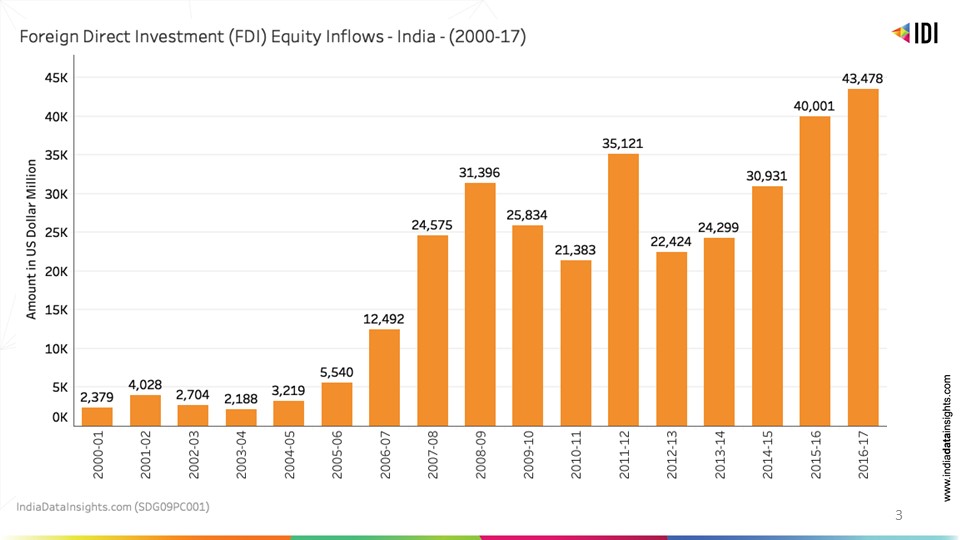
And receiving more foreign capital than ever, marking us as an attractive investment destination.
How much distance have we travelled towards development goals in the last few decades?
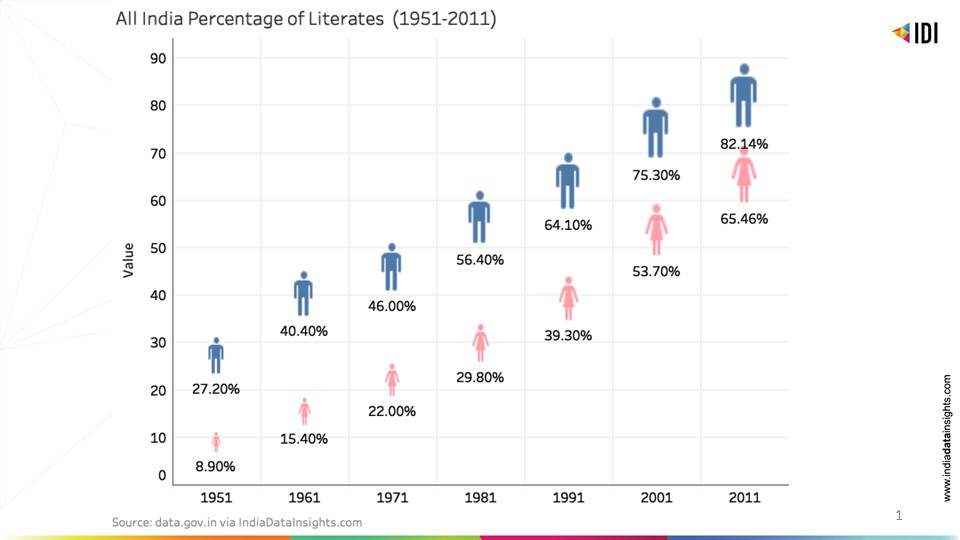
Did you know that around the time India became a republic on 26th January 1950, only about 18 per cent of our population was literate? And where do we stand after six decades?
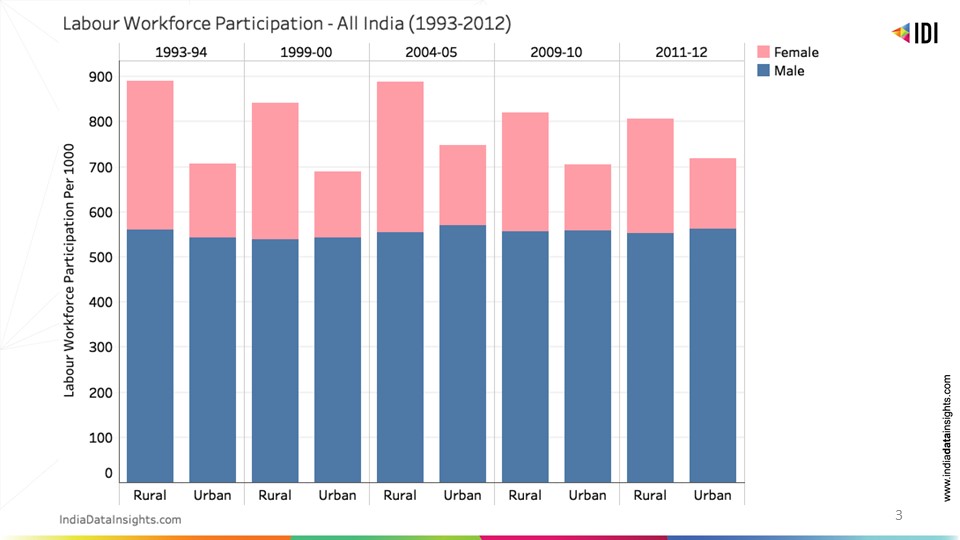
But does this provide organised employment opportunities to more of us? This is what our data on labour force participation rate shows:
On the environment front, we have successfully curbed our consumption of ozone-depleting substances. We have even managed to improve our forest cover slightly, but our carbon emissions have increased too:
True, the picture is not all rosy. India is vast, diverse and complex. We are leap-frogging into development with digital transformation and an educated as well as aspiring middle class.
But we do have massive societal challenges to address. Widespread malnutrition, urban pollution, inequalities, massive employment challenges, skewed gender ratio, a slow-moving judicial system and many such systemic issues need our urgent attention and action.
But unless we know where the problems are and their magnitude, how do we begin to tackle them?
In the uncharted territory of ever-changing societal challenges, data acts as a navigation aid. It helps you objectively assess the size and the location of the problems. Without the data guide, we will be lost as data is powerful.
Also Read: From Leading Contingents to Thrilling Stunts: R-Day Parade to Showcase Women Power!
Let’s harness the power of data to make sharper decisions and achieve a better impact. On this Republic Day, let’s resolve to look at facts and act fast for better India!
India Data Insights is a data guide for social sector professionals, providing them ready-to-use data charts and interactive dashboards for sharper and quicker decision making.
Featured image source
Like this story? Or have something to share?
Write to us: [email protected].
Connect with us on Facebook and Twitter.
If you found our stories insightful, informative, or even just enjoyable, we invite you to consider making a voluntary payment to support the work we do at The Better India. Your contribution helps us continue producing quality content that educates, inspires, and drives positive change.
Choose one of the payment options below for your contribution-
By paying for the stories you value, you directly contribute to sustaining our efforts focused on making a difference in the world. Together, let’s ensure that impactful stories continue to be told and shared, enriching lives and communities alike.
Thank you for your support. Here are some frequently asked questions you might find helpful to know why you are contributing?

This story made me
-
 97
97 -
 121
121 -
 89
89 -
 167
167


