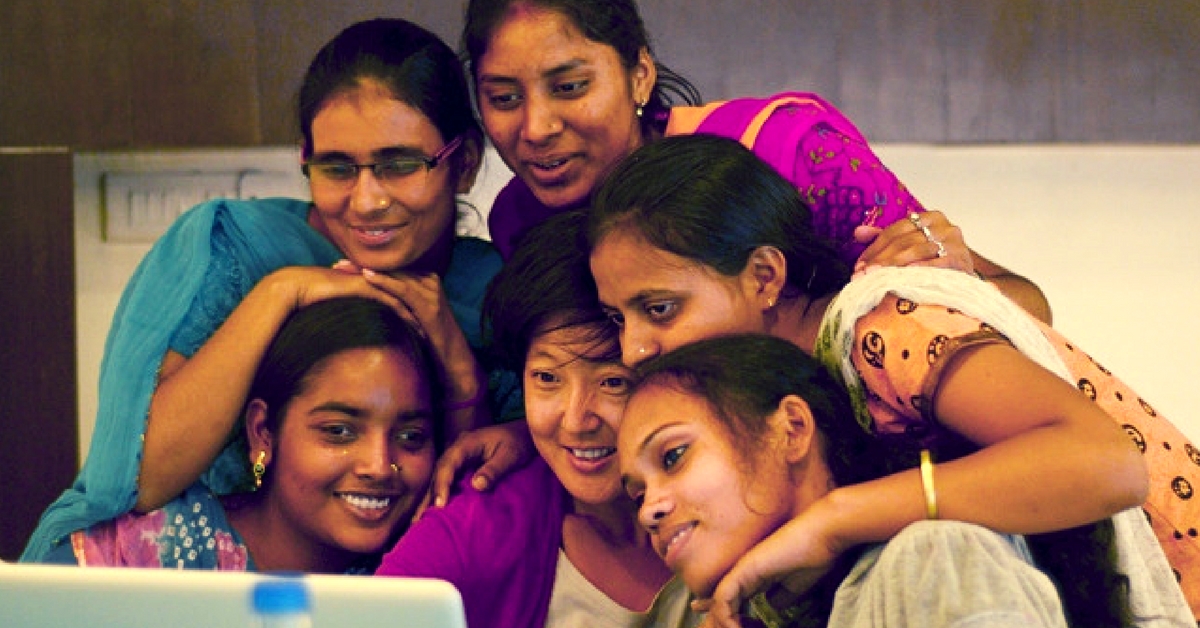
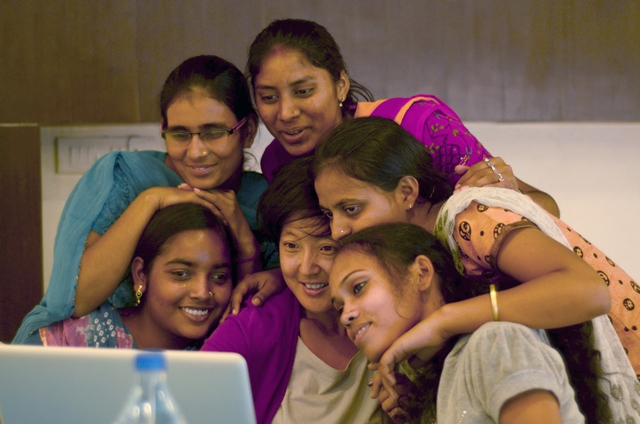
This Website Could Galvanise the Youth in India to Actively Participate in Governance and Change
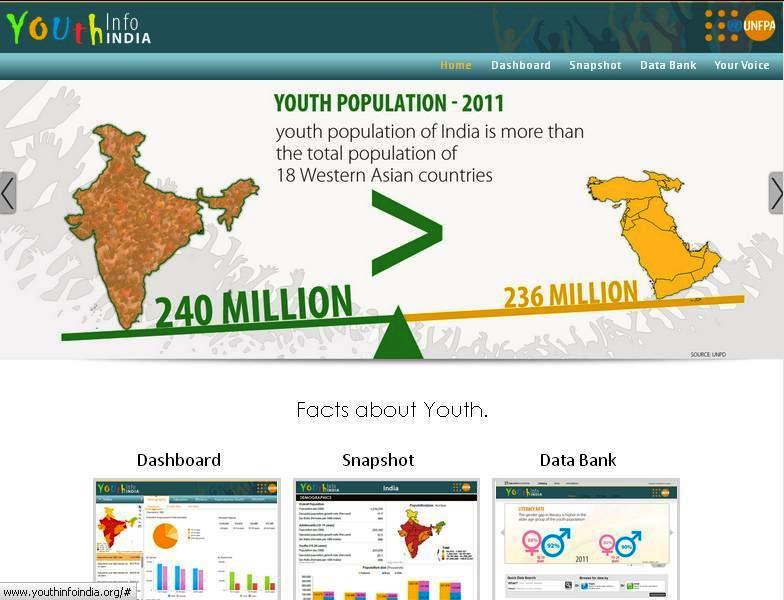
How’s this for the perfect hang out? A place where you get to meet the youth of India, all 231,878,057 of them in the age group of 15-24. No kidding. A new, user-friendly portal – YouthInfoIndia.org – puts together all the available data on the country’s young population.
How’s this for the perfect hang out? A place where you get to meet the youth of India, all 231,878,057 of them in the age group of 15-24. No kidding. A new, user-friendly portal – YouthInfoIndia.org – puts together on a single platform for the first time, all the available data on the country’s young population culled from the 2011 census, the National Family Health Survey-3 (NFHS-3), the National Sample Survey Office (NSSO), and many other credible sources. What’s more, this website, which is supported by United Nations Population Fund (UNFPA), is both fun and easy to browse – with a one-click access to the data, put together in a manner that addresses various requirements.
Besides, it is extensive in reach and – most delightful of all – is absolutely free!
If you are wondering why such a portal is significant, Frederika Meijer, UNFPA representative for India/Bhutan, has an answer. She believes that youth in this country can be a great asset if they receive adequate developmental inputs. However, in order to ensure this policy-makers and society in general must get the big picture. According to Meijer, “To make sure that policy-makers have relevant data, analysis, and young people’s views while they formulate policies, UNFPA and its partners have developed YouthInfo India. The portal is a lively place where you can spend time getting to know more about India’s young people.”
The website is envisaged as comprising two broad sections. The first has to do with data presented on 190 indicators. There is a data bank that allows the user to access information quickly with the help of parametres such as keyword, topic and region. There’s an exciting feature that facilitates visitors to create their own colour-coded infographics, pie charts and maps. All that is required is to feed the requirements into ‘DevInfo India’, a dashboard that displays the socio-economic profiles for states in India with up-to-date data, and generate impressive looking graphics. For instance, if you want to make a graph on changes in the age of marriage in the city of Mumbai between 1971 and 2011, go ahead with your clicks and wait for a nifty downloadable graph to appear. Should you need to map the demographic profile of a particular geographic area, then that too is possible with a few smart moves.
Seriously fun is the section called ‘Your Voice’. Here you get to share your opinion on what needs to change in order to make India a better place.
You never know, your views, which you may secretly consider insignificant and unexceptional, could actually find resonance in the highest echelons of power and help set the development agendas of the future! After all, never has the country been more prepared to listen to its young than today. Youth – those in the age group of 15-24 years – comprise 19.2 of the country’s population and are certainly the flavour of the times. That half its population is below 25 years potentially gives India a demographic edge over countries with ageing populations because it means that it has a large workforce of people with able bodies and innovative minds who could contribute decisively to social and economic development over the next twenty years.
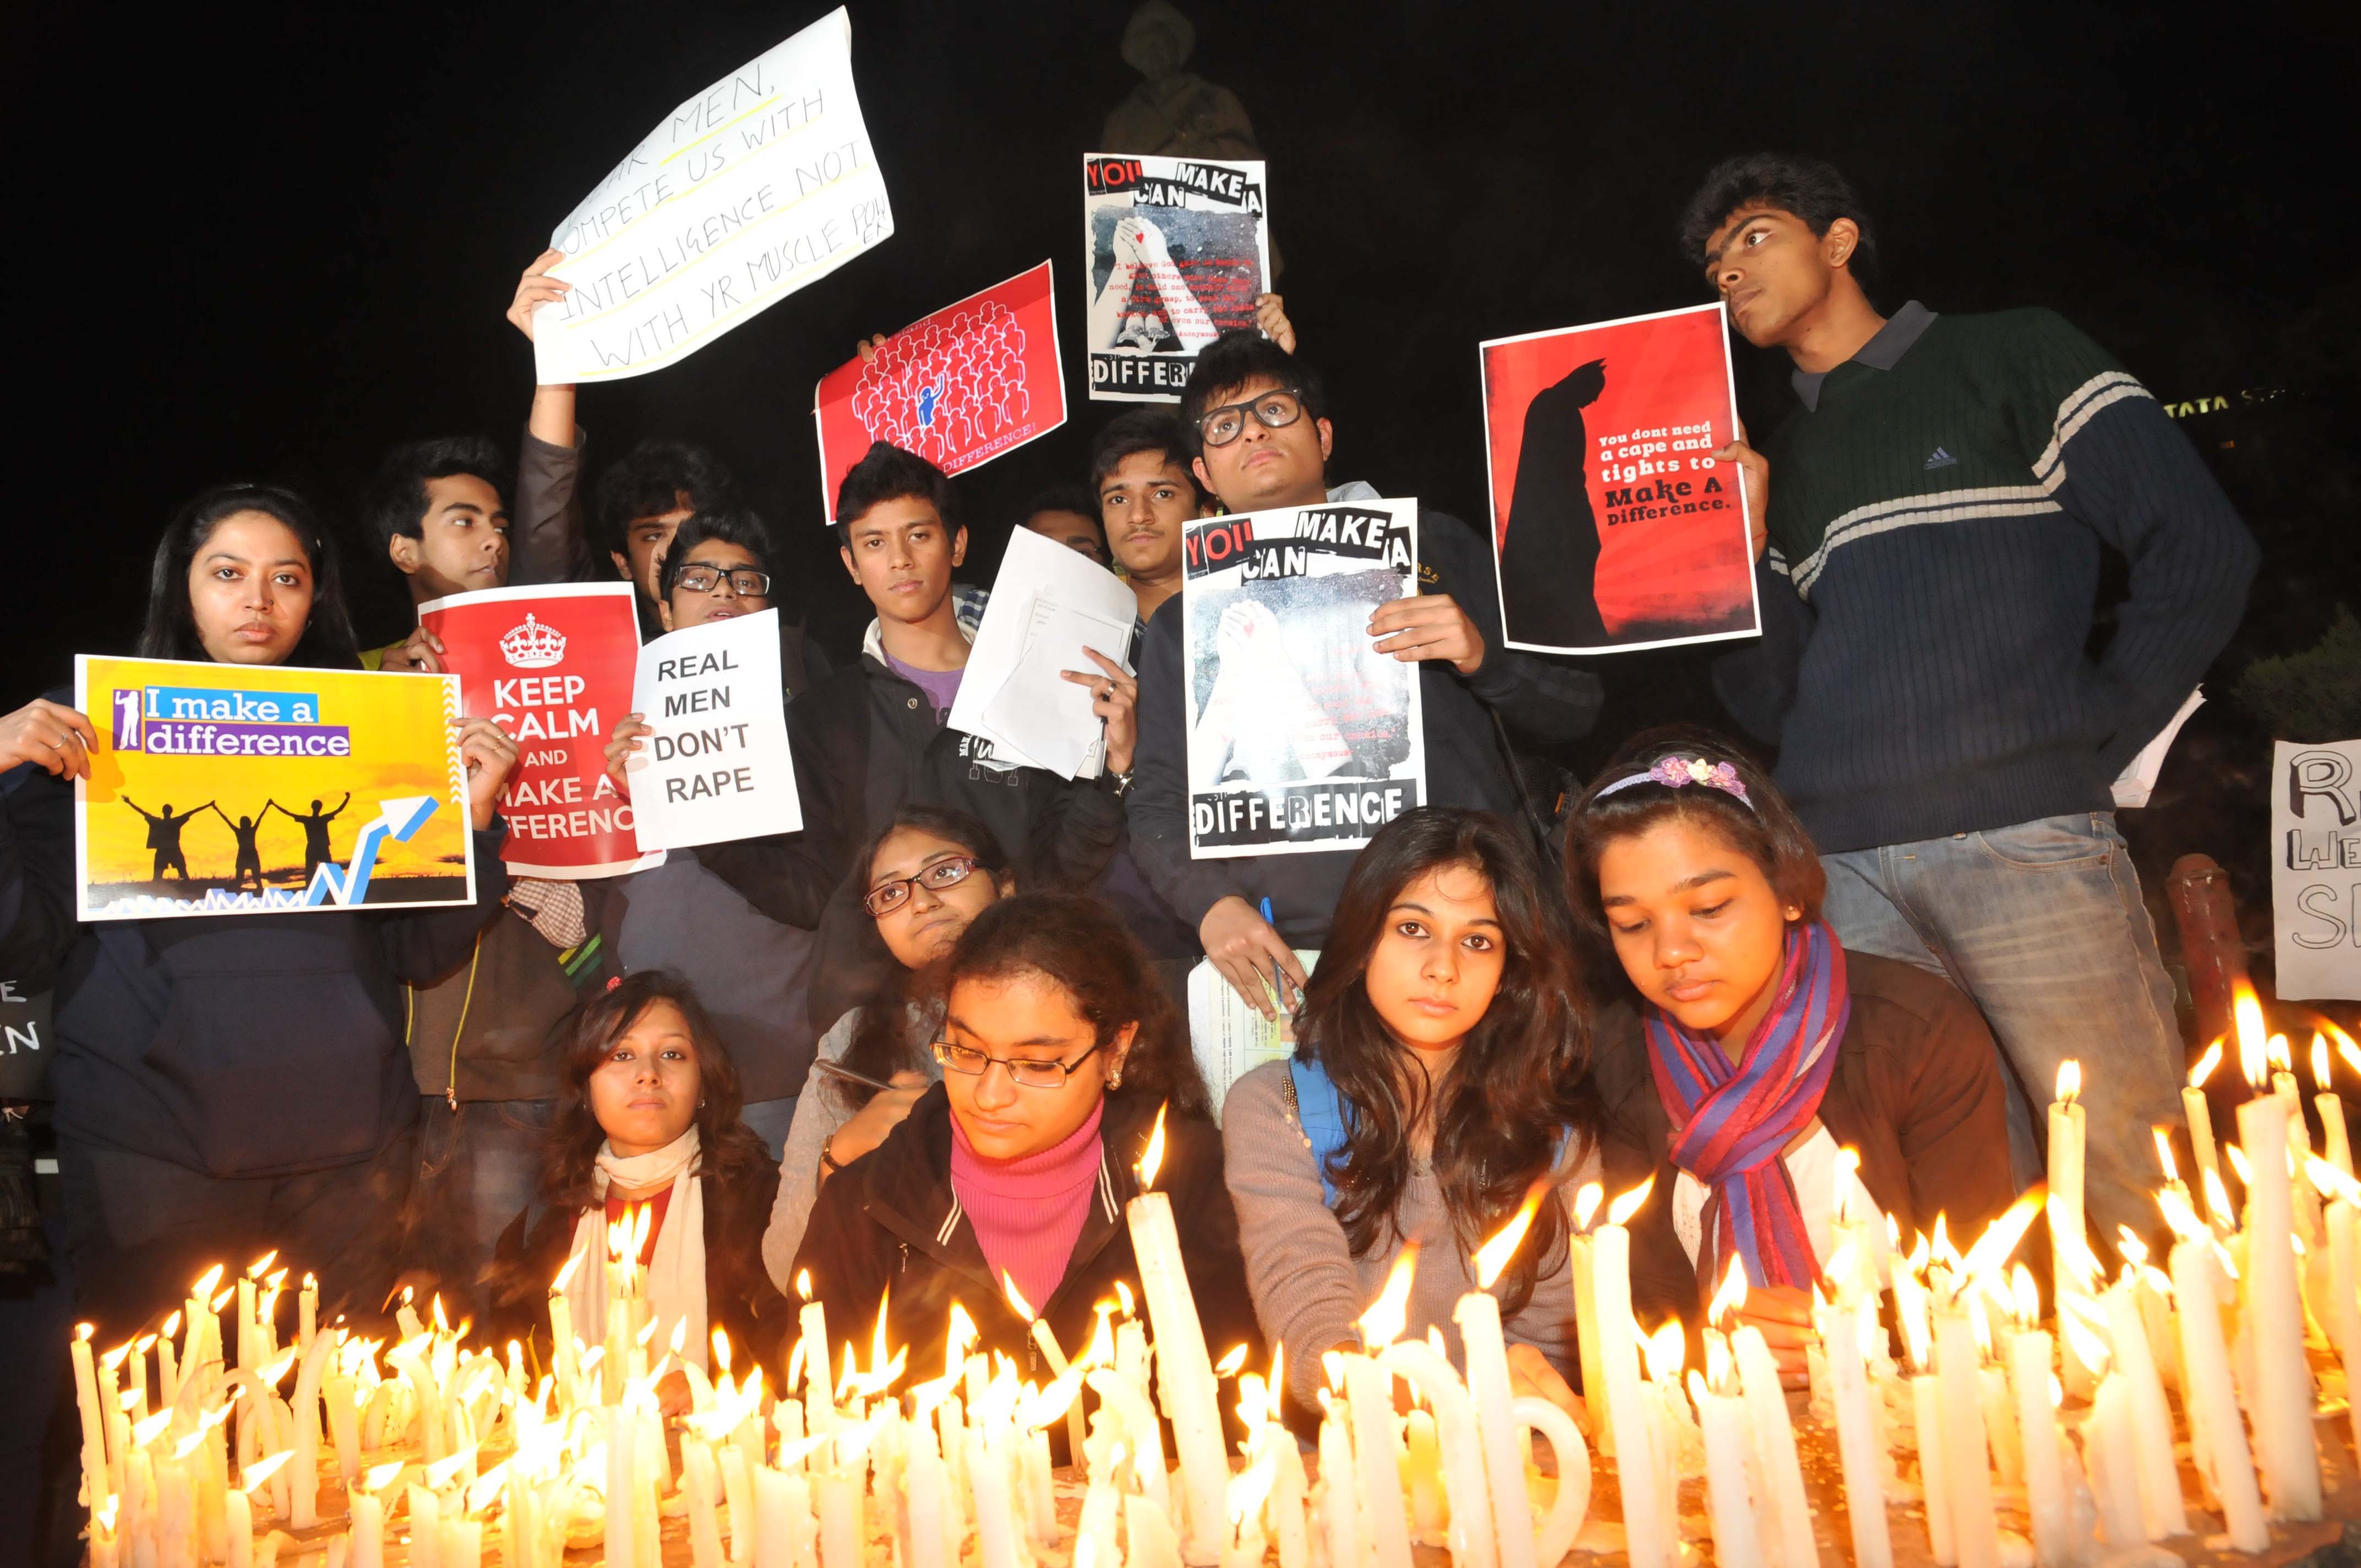
Already the disproportionate impact of the youth cohort in achieving transformations in the social and political landscape is becoming more apparent with each passing day. In 2011, it was the networking and activism of young volunteers that helped multiply support for social activist Anna Hazare’s India Against Corruption campaign. In 2012, it was their outrage that forced the government to change its criminal justice policies and reform the law on sexual assault. In 2013, once again it was Indian youth who were credited with having brought a debutante political entity like the Aam Aadmi Party to power in Delhi.
So youth is a happening group, no doubt about that. But there are also major challenges they are faced with today, as the data from YouthInfoIndia.org makes abundantly clear. Employment is an area of great concern, especially for urban youngsters. Work participation rate for those in the 20-24 age group in our urban pockets is as low as 37.5 per cent. Significant too is the fact that a high percentage of employed youth from the Scheduled Castes and Scheduled Tribes communities are working in agriculture.
Early marriage is still very much a grim reality, with women bearing the unfortunate consequences of this age-old ‘tradition’. According to District Level Household and Facility Survey DLHS-3 (2007-08) data, the percentage of girls who married before the legal age 18 was still a high 22.1 per cent, with the percentage of women aged 20-24 who had given birth by 18 standing at 21.7 per cent. This is an eloquent pointer to low contraceptive use in this cohort – at 22.2 per cent.
Not surprisingly then, the percentage of women aged 15-19, who reported any level of anaemia in 2005-2006 was 55.8, with the percentage of men in the same age group at a lower, but still disturbing, 30.2 per cent.
Inequalities continue to stare us in the face even six decades after Constitutional guarantees of equality came into force. We know, for instance, that literacy levels dip if you happen to be a Dalit or tribal youth; it is also lower for young people who live in rural India.
But, of course, the most conspicuous inequality of all is that between girls and boys, women and men, and nothing perhaps highlights it more than the fact that the gender sex ratio among adolescents aged 10-19, is 898 girls for every 1000 boys. Occasionally, the comparisons work against the male sex: the percentage of male youth aged 15-24 who are current users of any tobacco product stood at 27.4 per cent, with females faring better at 8.3 per cent.
Numbers tell stories, and the stories that emerge from YouthInfoIndia.org should encourage young people everywhere in India to advocate for change and be the change themselves. At the same time, these numbers should also give policy-makers the perspective they’d need to create policies that effectively address the needs of this demographic, which is the future.
Visit the website here.
Like this story? Or have something to share? Write to us: [email protected], or connect with us on Facebook and Twitter (@thebetterindia).
If you found our stories insightful, informative, or even just enjoyable, we invite you to consider making a voluntary payment to support the work we do at The Better India. Your contribution helps us continue producing quality content that educates, inspires, and drives positive change.
Choose one of the payment options below for your contribution-
By paying for the stories you value, you directly contribute to sustaining our efforts focused on making a difference in the world. Together, let’s ensure that impactful stories continue to be told and shared, enriching lives and communities alike.
Thank you for your support. Here are some frequently asked questions you might find helpful to know why you are contributing?

This story made me
-
 97
97 -
 121
121 -
 89
89 -
 167
167