
How India Calculated the Height of Mt Everest To Amazing Accuracy
Just using simple geometric ideas, Indian mathematicians estimated the height of Mt Everest which was its official height until recently
After years of disagreement, Nepal and China recently reached a consensus on the height of Mount Everest. Until now, the globally accepted height, taken from the 1955 Survey of India, was 8,848 metres. The updated result declared last week was 8,848.86 metres — a mere 86 cm more than the observation made 65 years ago.
For an order of 8,000 metres, this is a minuscule difference — about 0.01%. To get an idea of the scale, this would be the equivalent of adding four minutes to a month of 31 days. At a time when advanced technologies like GPS and LiDAR were not around, how did the Indian surveyors of 1955 estimate the height so accurately? And where does the difference of 86 cm come from?
The basic principle: Triangulation
The basic idea involved in measuring a mountain is very simple and very old. It is the same geometric principle that was used even 100 years before the Survey of India, when Everest was first measured and discovered to be the highest mountain peak. As part of the Great Trigonometrical Survey, a 19-year-old Indian mathematician, Sikdar, calculated the height of the Everest (back then, known as Peak XV) in 1852 as 8,840. Just 8 metres short!
Firstly, let us look at how to calculate the height of a pole or a building, without scaling it with a ruler. In the image below, we want to measure the unknown height of the pole (H)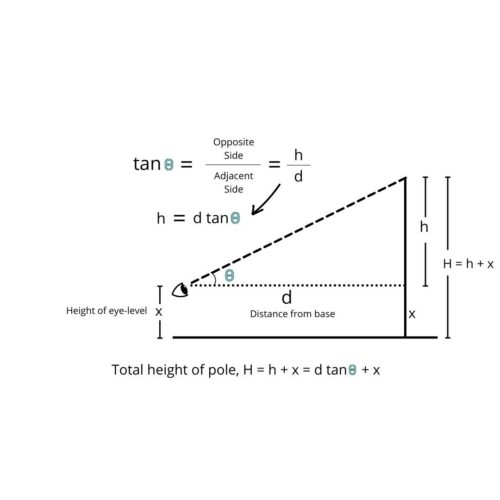 To do so, we look at the top of the pole from a certain known distance, from the base of the pole (d). A telescope-like instrument known as a theodolite outputs the angle Θ between the top of the pole and the horizontal ground. These are often used by land surveyors near construction sites.
As seen in the diagram, these three lines — (1) the distance between the eye and the pole, (2) the line joining the eye and the top of the pole, and (3) the unknown part of the height of the pole — form a right-angled triangle. Using the relationships between the angles and the sides of this triangle, we can now calculate the unknown segment h. Calculating distances using triangles is known as triangulation.
In a right-angled triangle, the tangent of an angle is the ratio between the length of the side opposite to it and the length of the side adjacent to it. In this case, tanΘ = h/d. From this, we can get h as d multiplied by tanΘ,
For example, if d = 100 metres and Θ = 60°, then h = 100 X tan 60°. For those unfamiliar with trigonometry, the tangents of angles have fixed values. Tan 60° has a value of 1.732. You can then calculate h as 173.2 metres. Suppose the height of the eye-level, x, is 2 metres, then the total height of the pole is 175.2 metres.
The height of a mountain
Applying the above geometric estimation directly to a mountain is not possible, as we do not know where exactly the base of the mountain lies. But it’s easy to solve this. All we need to do is measure the angle to the peak from two different points, separated by a distance d. This will yield two right-angled triangles with a common side along the mountain. The geometry looks as follows.
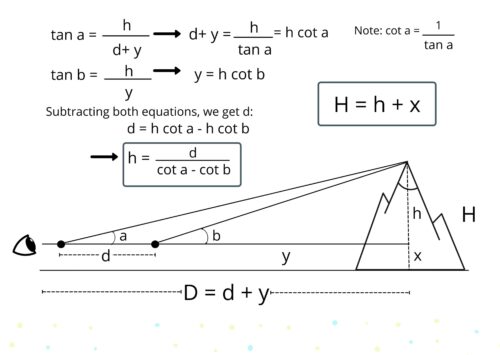
Now, the height of the mountain can be expressed using the distance between the two viewing points and the co-tangents of the angles subtended, as shown in the figure. Co-tangents are the reciprocal of tangents.
Other corrections: Tweak tweak tweak
There are a few more complications to account for, before we can get a satisfactory estimate.
First of all, mountains don’t sit on an even surface. There’s no way to tell if our viewing points are on the same horizontal plane as the mountain base. To correct this, we need to know each point’s height and the base’s height from mean sea level. This is done through a technique called high-precision levelling.
To calculate the local mean sea level, we also need to take into consideration the effect of gravity. A large mountain range such as the Himalayas will have a lot of gravitational influence, which means that the local sea level has to be taken higher than usual. Gravitometers and other instruments are used to measure the local gravity and fix the final baseline.
Lastly, the angles of elevation are affected by the refraction of light due to the dense layers of mountain air. As light moves from one layer of the atmosphere into another with different density, it gets deflected. The result is that the peak is not where it appears to be. This is similar to how a stick dipped at an angle in a container of water looks bent. Therefore, in the calculation of the angles, the shift due to multiple refractions also needs to be adjusted.
We do not know yet if the 86 cm difference from the 1955 Indian survey is due to better measurements of these corrections terms, or due to an actual increase in the mountain’s height. The Himalayas are, after all, fold mountains, and the tectonic activity beneath pushes them up continuously. The paper detailing the new measurement is to be published soon, and may clarify the source of the deviation better.
But one thing is clear — some simple trigonometry and a few dedicated mathematicians can lead to astoundingly accurate results.
If you found our stories insightful, informative, or even just enjoyable, we invite you to consider making a voluntary payment to support the work we do at The Better India. Your contribution helps us continue producing quality content that educates, inspires, and drives positive change.
Choose one of the payment options below for your contribution-
By paying for the stories you value, you directly contribute to sustaining our efforts focused on making a difference in the world. Together, let’s ensure that impactful stories continue to be told and shared, enriching lives and communities alike.
Thank you for your support. Here are some frequently asked questions you might find helpful to know why you are contributing?


This story made me
-
 97
97 -
 121
121 -
 89
89 -
 167
167